Having been a Senior Operations Director at Genentech, I gained a passion for improving operations and efficiency at my company. At Genentech, in the 1990’s, I worked with AIQ while solving many technically demanding problems involving IT and access to our systems by our executives. After joining Keynote Systems, I began to take stock of their systems and processes. When it came to a particular area that was core to our business (the global data and colocation network that powers Keynote’s core product – a global synthetic Cloud measurement system used by most of the large technology companies such as Microsoft), I invited AIQ to come and take a look. They quickly identified levels of complexity that could be simplified and improved upon, but more importantly, they identified several million dollars of savings which could be produced through their process. Based on the cost justification that was created through their high level savings estimate, I was able to gain sponsorship from my CFO, Jim Peterson. On that basis, AIQ set to work and was quickly deploying its process among several expense areas.
The result of this effort has been a $10M savings, which has really gotten the attention of everyone and helped the company redeploy capital in a way that makes it an even better company with a higher performing product.
At that time, one of the biggest savings that AIQ immediately delivered was rather shocking – a full 90% savings on our inbound service. This really got everyone’s attention.
Then AIQ proceeded to deliver a 70% reduction on our collaboration services. By the time they started working on our mobility and gaining big reductions there, almost all of my team, and my boss, a VP, were on board, and were seriously interested and mostly aligned.
While these early savings were being recorded/reported, they were working on our global colocation and network that I mentioned previously. They were digesting contracts, reviewing bill data, reviewing maps, looking at speeds and feeds and locations and understanding the unique requirements of our service offerings (such as requiring cellular antennas at each of our 100+ global collocation sites.)
About this time, we were acquired by Private Equity. Our PE owners began to dial into our weekly calls and observe the AIQ process, our interaction with them, and see the progress that was being made and reported by Finance. As a result of the visibility that was gained, our PE started carefully tracking AIQ process and outcomes.
Subsequently, Dynatrace was acquired, Keynote was rolled up into Dynatrace, and I became their Senior Director of Cloud Production. At Dynatrace, I followed much the same process while working with AIQ. During the project, AIQ also helped Dynatrace rationalize, optimize and save money on the combined networks. This allowed us to improve performance, scale, and again, save money. The result of this effort has been a $10M savings, which has really gotten the attention of everyone and helped the company redeploy capital in a way that makes it an even better company with a higher-performing product.
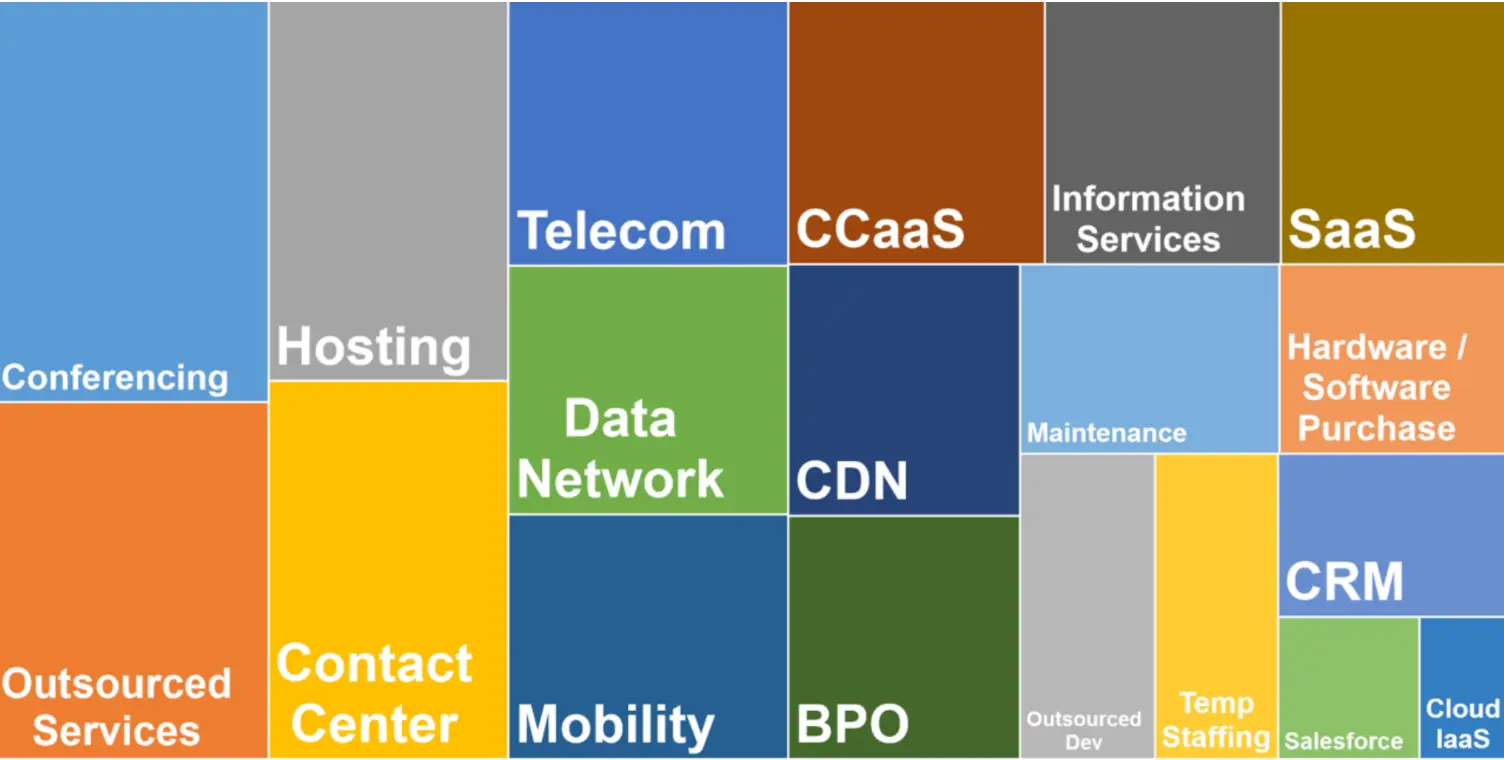
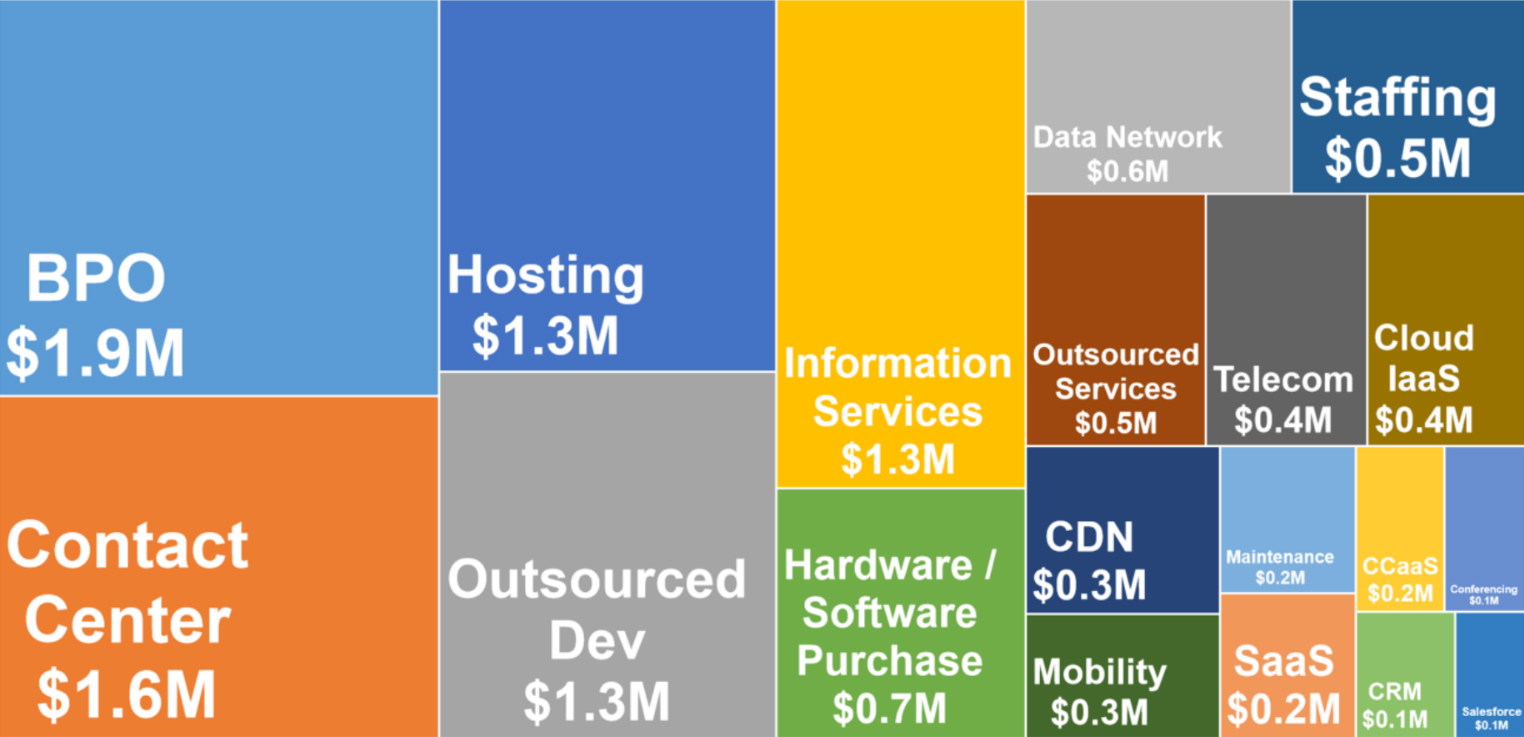
AIQ recently tracked and reported top savings areas for a group of CFO’s in charge of around 35 portfolio companies owned by one of its Private Equity clients. There are two views provided in the illustrations below
As a result of this project, we now have all of our data centers optimally tracked, recorded, and organized with the latest uniform technology. It enabled us to readily deploy remote hands to specific items in our inventory anywhere in the world, as our levels of inventory, record keeping, and even contracts and other important assets are all current and correct. It has enabled our organization to perform at a much higher level and we no longer waste time trying to validate what is located at different locations across a global organization of inconsistent systems, as it once was.
5 QUICK SAVINGS ESTIMATE
As a CFO, how can you quickly estimate what kinds of savings you might expect through the AIQ process? Here’s a way to produce a gross order of magnitude guess without even talking to someone else, if you are a mid-market, PE owned technology enabled Portfolio Company:
5. A.2) The second graphic illustrates the average annual dollar savings per category attained among the top 100 categories. Keep in mind, these are for mid-market, PEowned technology-enabled portfolio companies. Your actual profile and outcome, of course, will vary.
5. B) Fortunately, as a CFO, there is an easier, surer way to estimate your potential savings than just picking a number from a matrix. If you want to receive a savings estimate calculated at a 95% level of certainty, you need only contact AIQ, who will send you an MNDA and a customized ERP template. Once you generate the ERP report described in the template and share it with AIQ, they will produce a customized savings estimate created just for you, using your data. You can then use that savings estimate to determine if the savings are material enough to warrant engaging AIQ to actually produce the savings. This is a quick and convenient way for you to make a high confidence savings estimate to include as part of your budget planning process.
Largest % Savings by Category